Debugging
Introduction
Section titled “Introduction”Where there’s code, there’s bugs.
Debugging is the process of identifying and fixing issues in your code. This guide will cover some common debugging techniques and tools that you can use to help you find and fix issues in your Harmony Music code.
1. Logging values with console.log()
Section titled “1. Logging values with console.log()”One of the simplest and most effective debugging techniques is logging.
Logging is the process of writing messages to the console to help you understand what your code is doing.
If you have been following the steps in the previous tutorial on Capturing Form Data, you will already be displaying messages in the console using console.log().
For example, your index.js file code should now look like this:
// Capture user's input on form submissionlet form = document.querySelector("form");
form.addEventListener("submit", function (event) { event.preventDefault();
let userEmail = document.querySelector("#email").value; let userLevel = document.querySelector("#level").value; let userHours = document.querySelector("#hoursPerWeek").value; console.log({ userEmail, userLevel, userHours });});As you will notice on line 10, this code logs the user’s email, level, and hours per week to the console when the form is submitted.
With this line in place, you can view these values in the browser’s developer tools console:
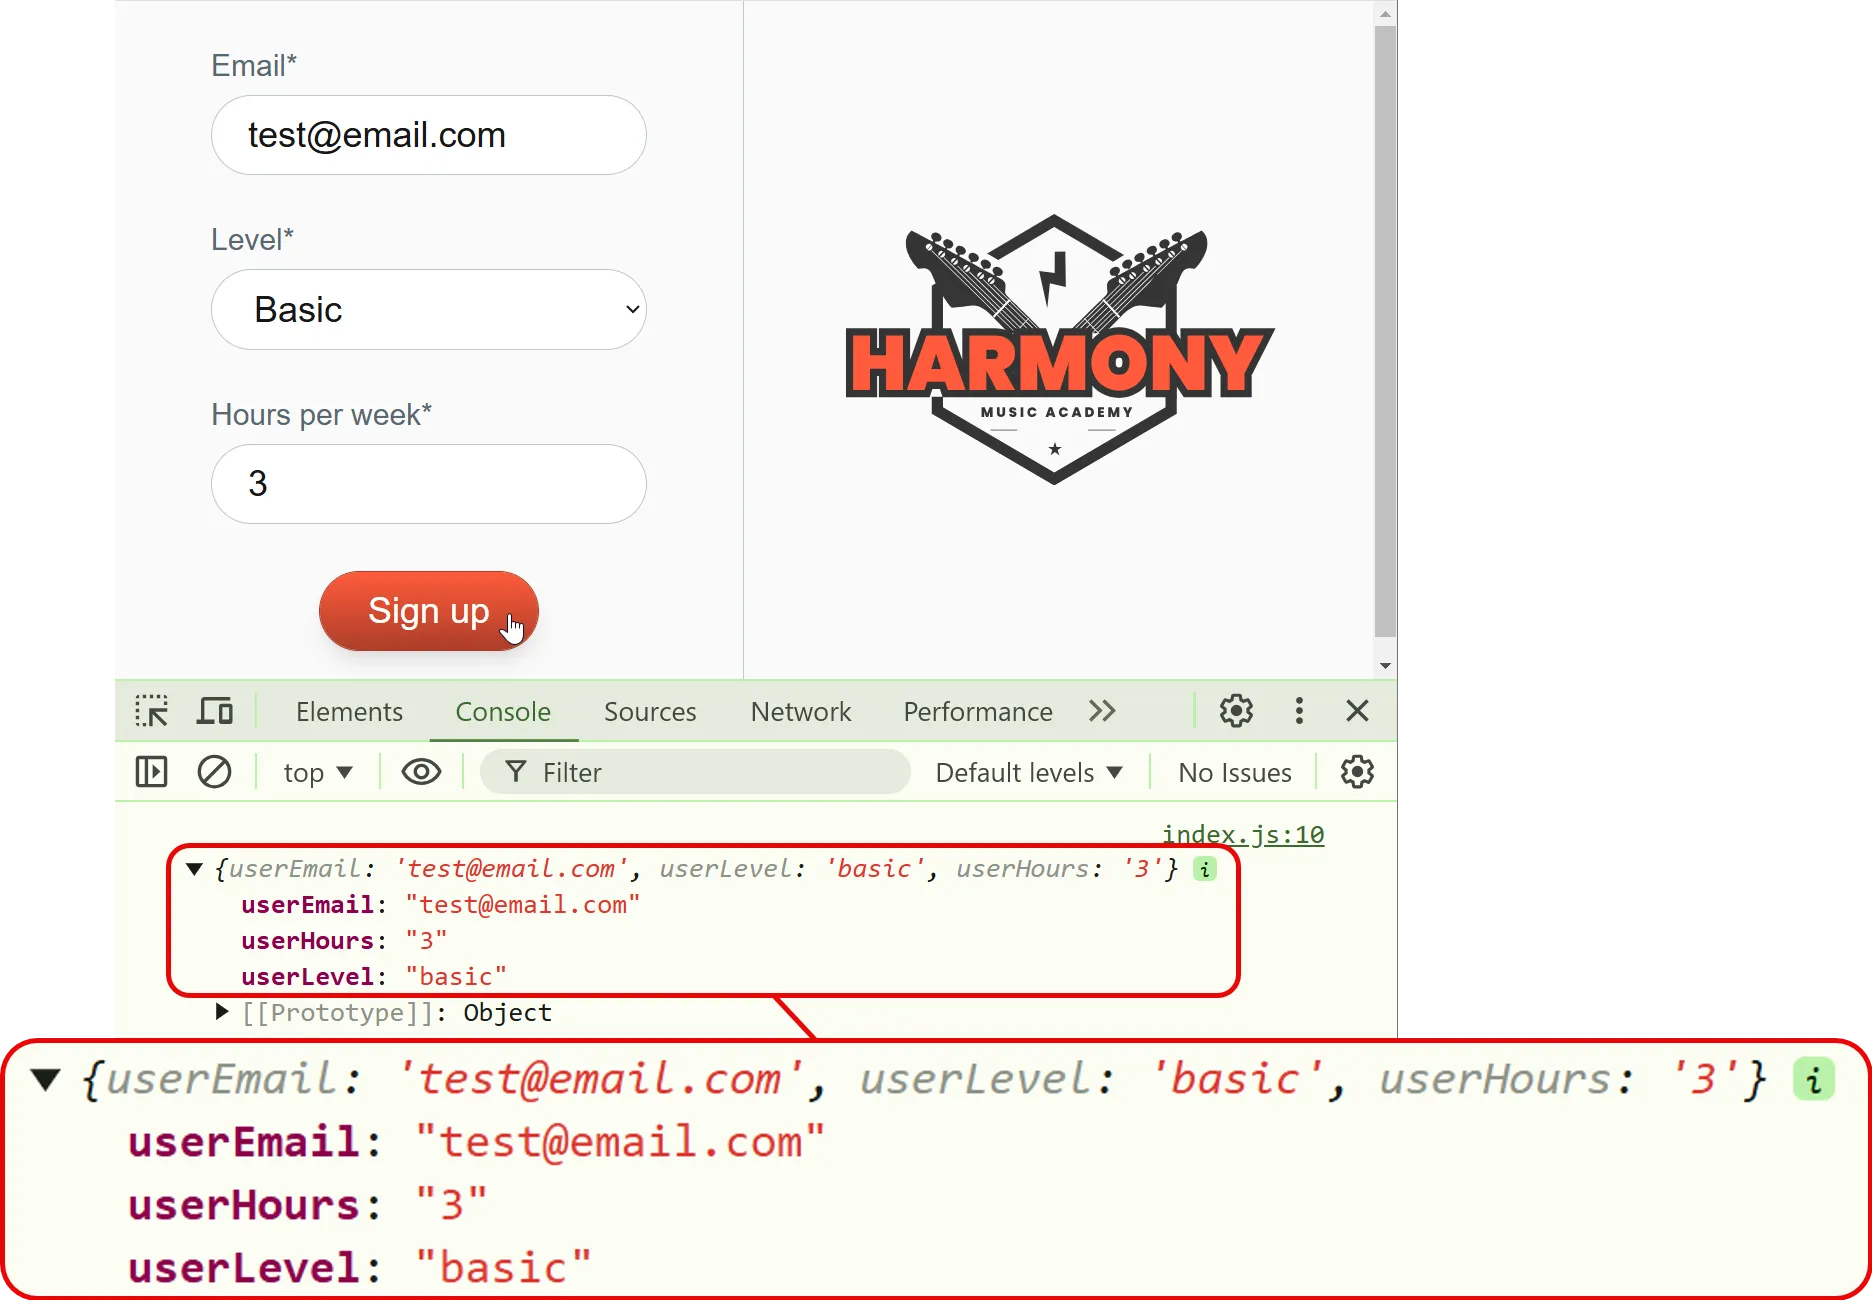
This helps a developer because they can see the values of these variables in the console and verify that the form data is being captured correctly.
2. Adding breakpoints in VS Code
Section titled “2. Adding breakpoints in VS Code”Another useful debugging technique is to add breakpoints to your code.
Breakpoints are markers that you can place in your code to pause execution at a specific point. This allows you to inspect the state of your code at that point in time.
To add a breakpoint in VS Code, follow the steps below:
a. Enable breakpoints in VS Code
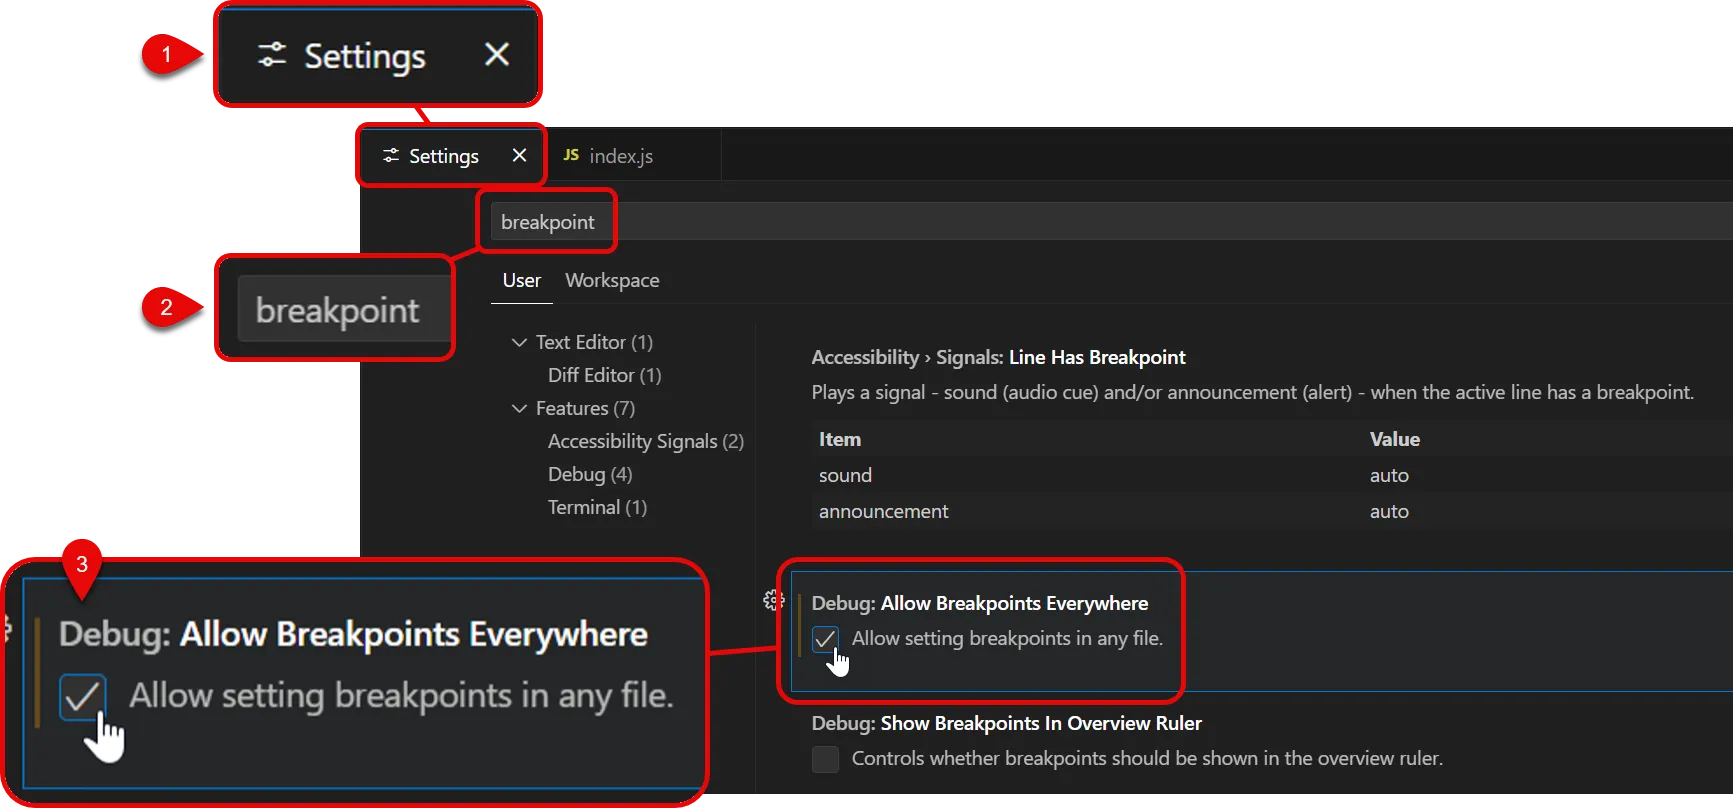
Section titled “a. Enable breakpoints in VS Code”- Open your VS Code settings panel by navigating to File > Preferences > Settings.
- Type in the word ‘breakpoint’ in the search bar.
- Check the box next to Debug > Allow Breakpoints Everywhere.
b. Set your breakpoint(s)
Section titled “b. Set your breakpoint(s)”You can set multiple breakpoints in your code to see what is happening at different points in your code execution.
-
Open
index.jsfrom your project. -
Click into the space to the left of the line number where you want to pause execution. A red dot will appear, indicating that a breakpoint has been set.
In our case, we will set two breakpoints: one on line 3 and a second on line 10 of the
index.jsfile.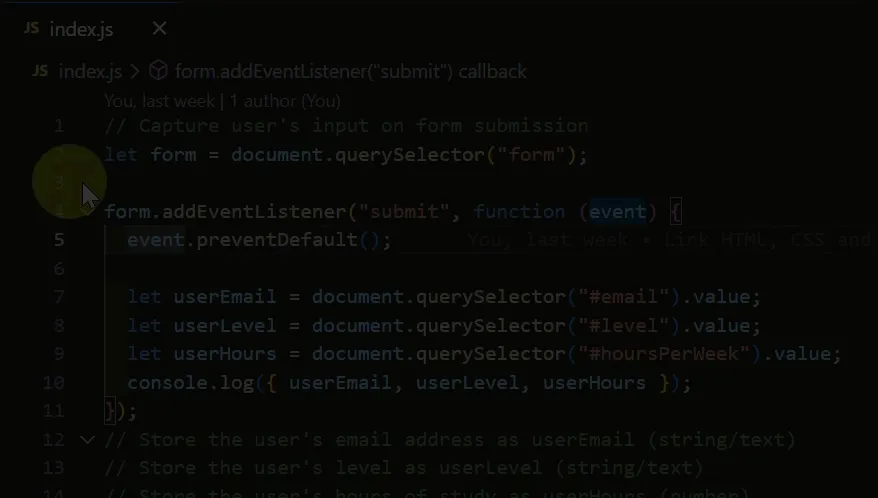
c. Enable JavaScript Debugger (extension)
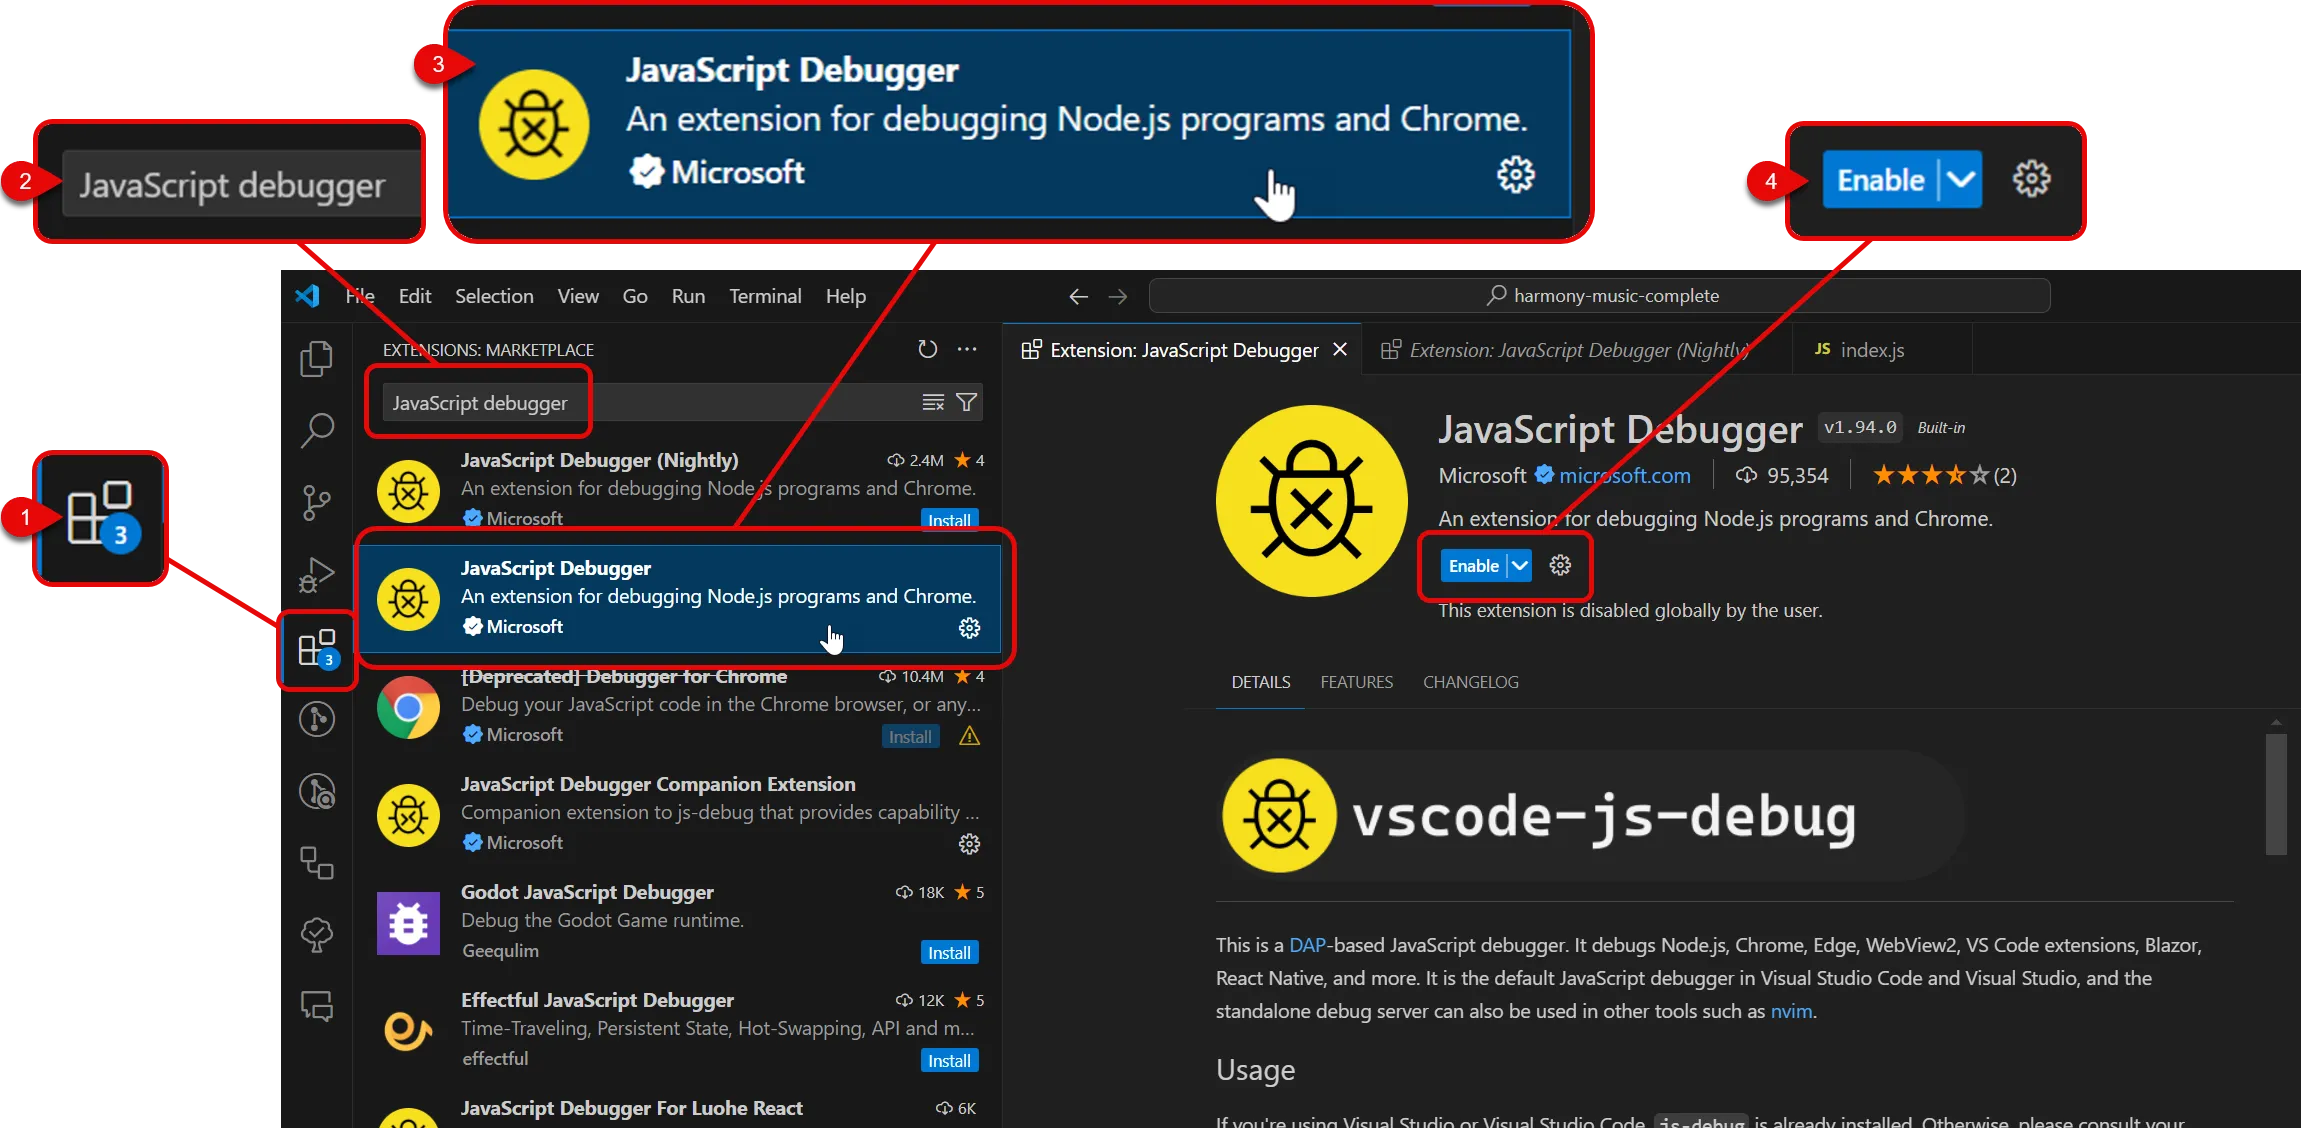
Section titled “c. Enable JavaScript Debugger (extension)”JavaScript debugging is built into VS Code, but you need to enable the JavaScript Debugger extension to use it.
-
Open the Extensions view by clicking on the square icon in the sidebar.
-
Search for JavaScript Debugger
-
Click the JavsaScript Debugger extension by Microsoft - NOT the JavaScript Debugger (Nightly) plugin.
-
Click on the Enable button.
d. Start debugging
Section titled “d. Start debugging”-
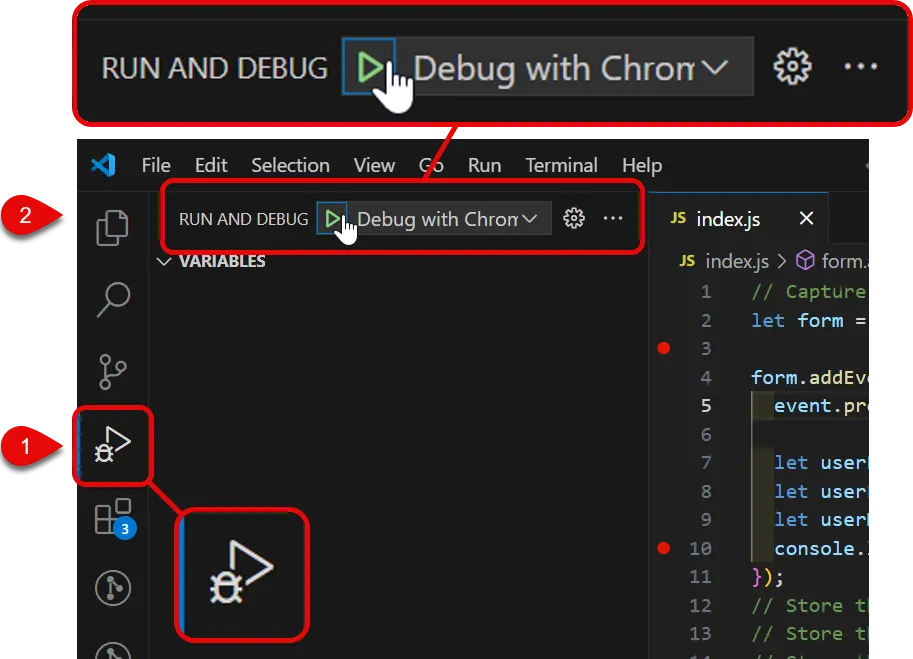
Open the debug panel by clicking on the bug icon in the sidebar.
-
Click on the green play button to start debugging.
-
Your code will pause execution at the first breakpoint you set.
In our case, this is on line 4 of the
index.jsfile (immediately after the empty line 3).At this point, the only variable that has been defined is
form. The value of this variable is displayed in the Variables panel on the left.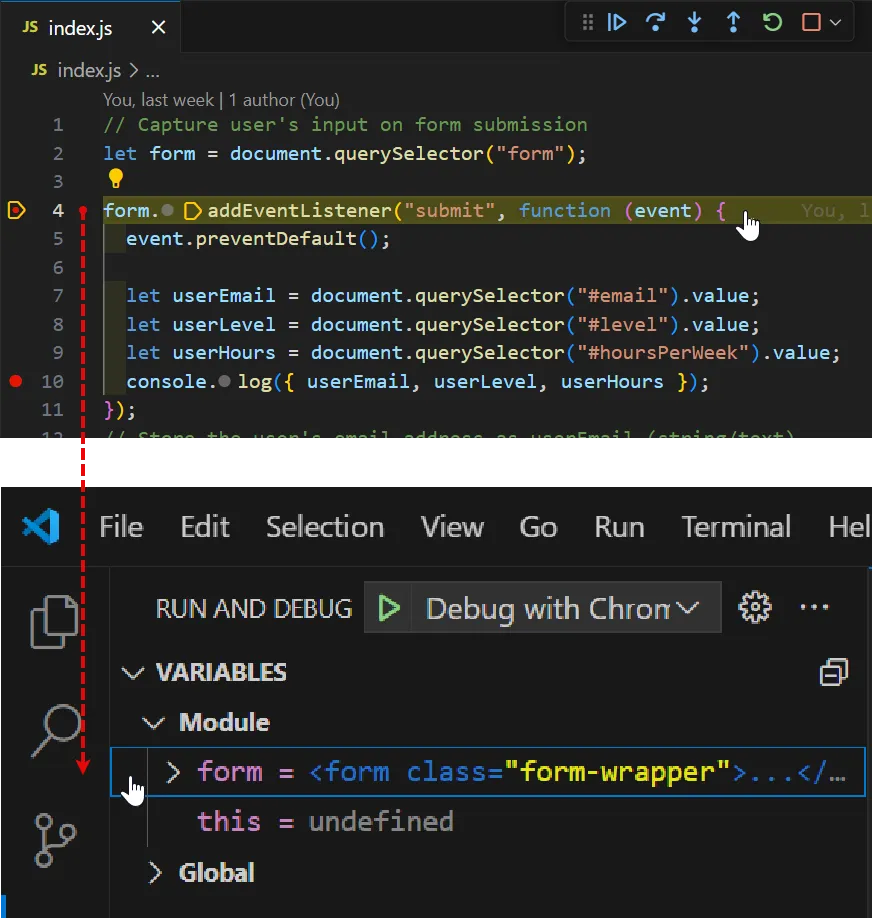
-
At the top of your VS Code screen you will see a set of debugging controls that you can use to step through your code, continue execution, and more.
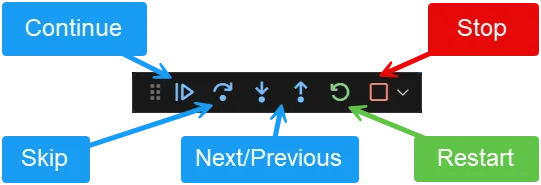
Click the ‘Continue’ button to move to the next breakpoint.
-
At this point, the debugging panel will seem to disappear. This is because the next breakpoint is on line 10, which is inside the event listener function.
To make the debugging panel reappear, fill in the form in your browser and click the submit button.
-
Your code will pause execution at the next breakpoint you set.
This time, you will see the values of
userEmail,userLevel, anduserHoursdisplayed in the Variables panel on the left.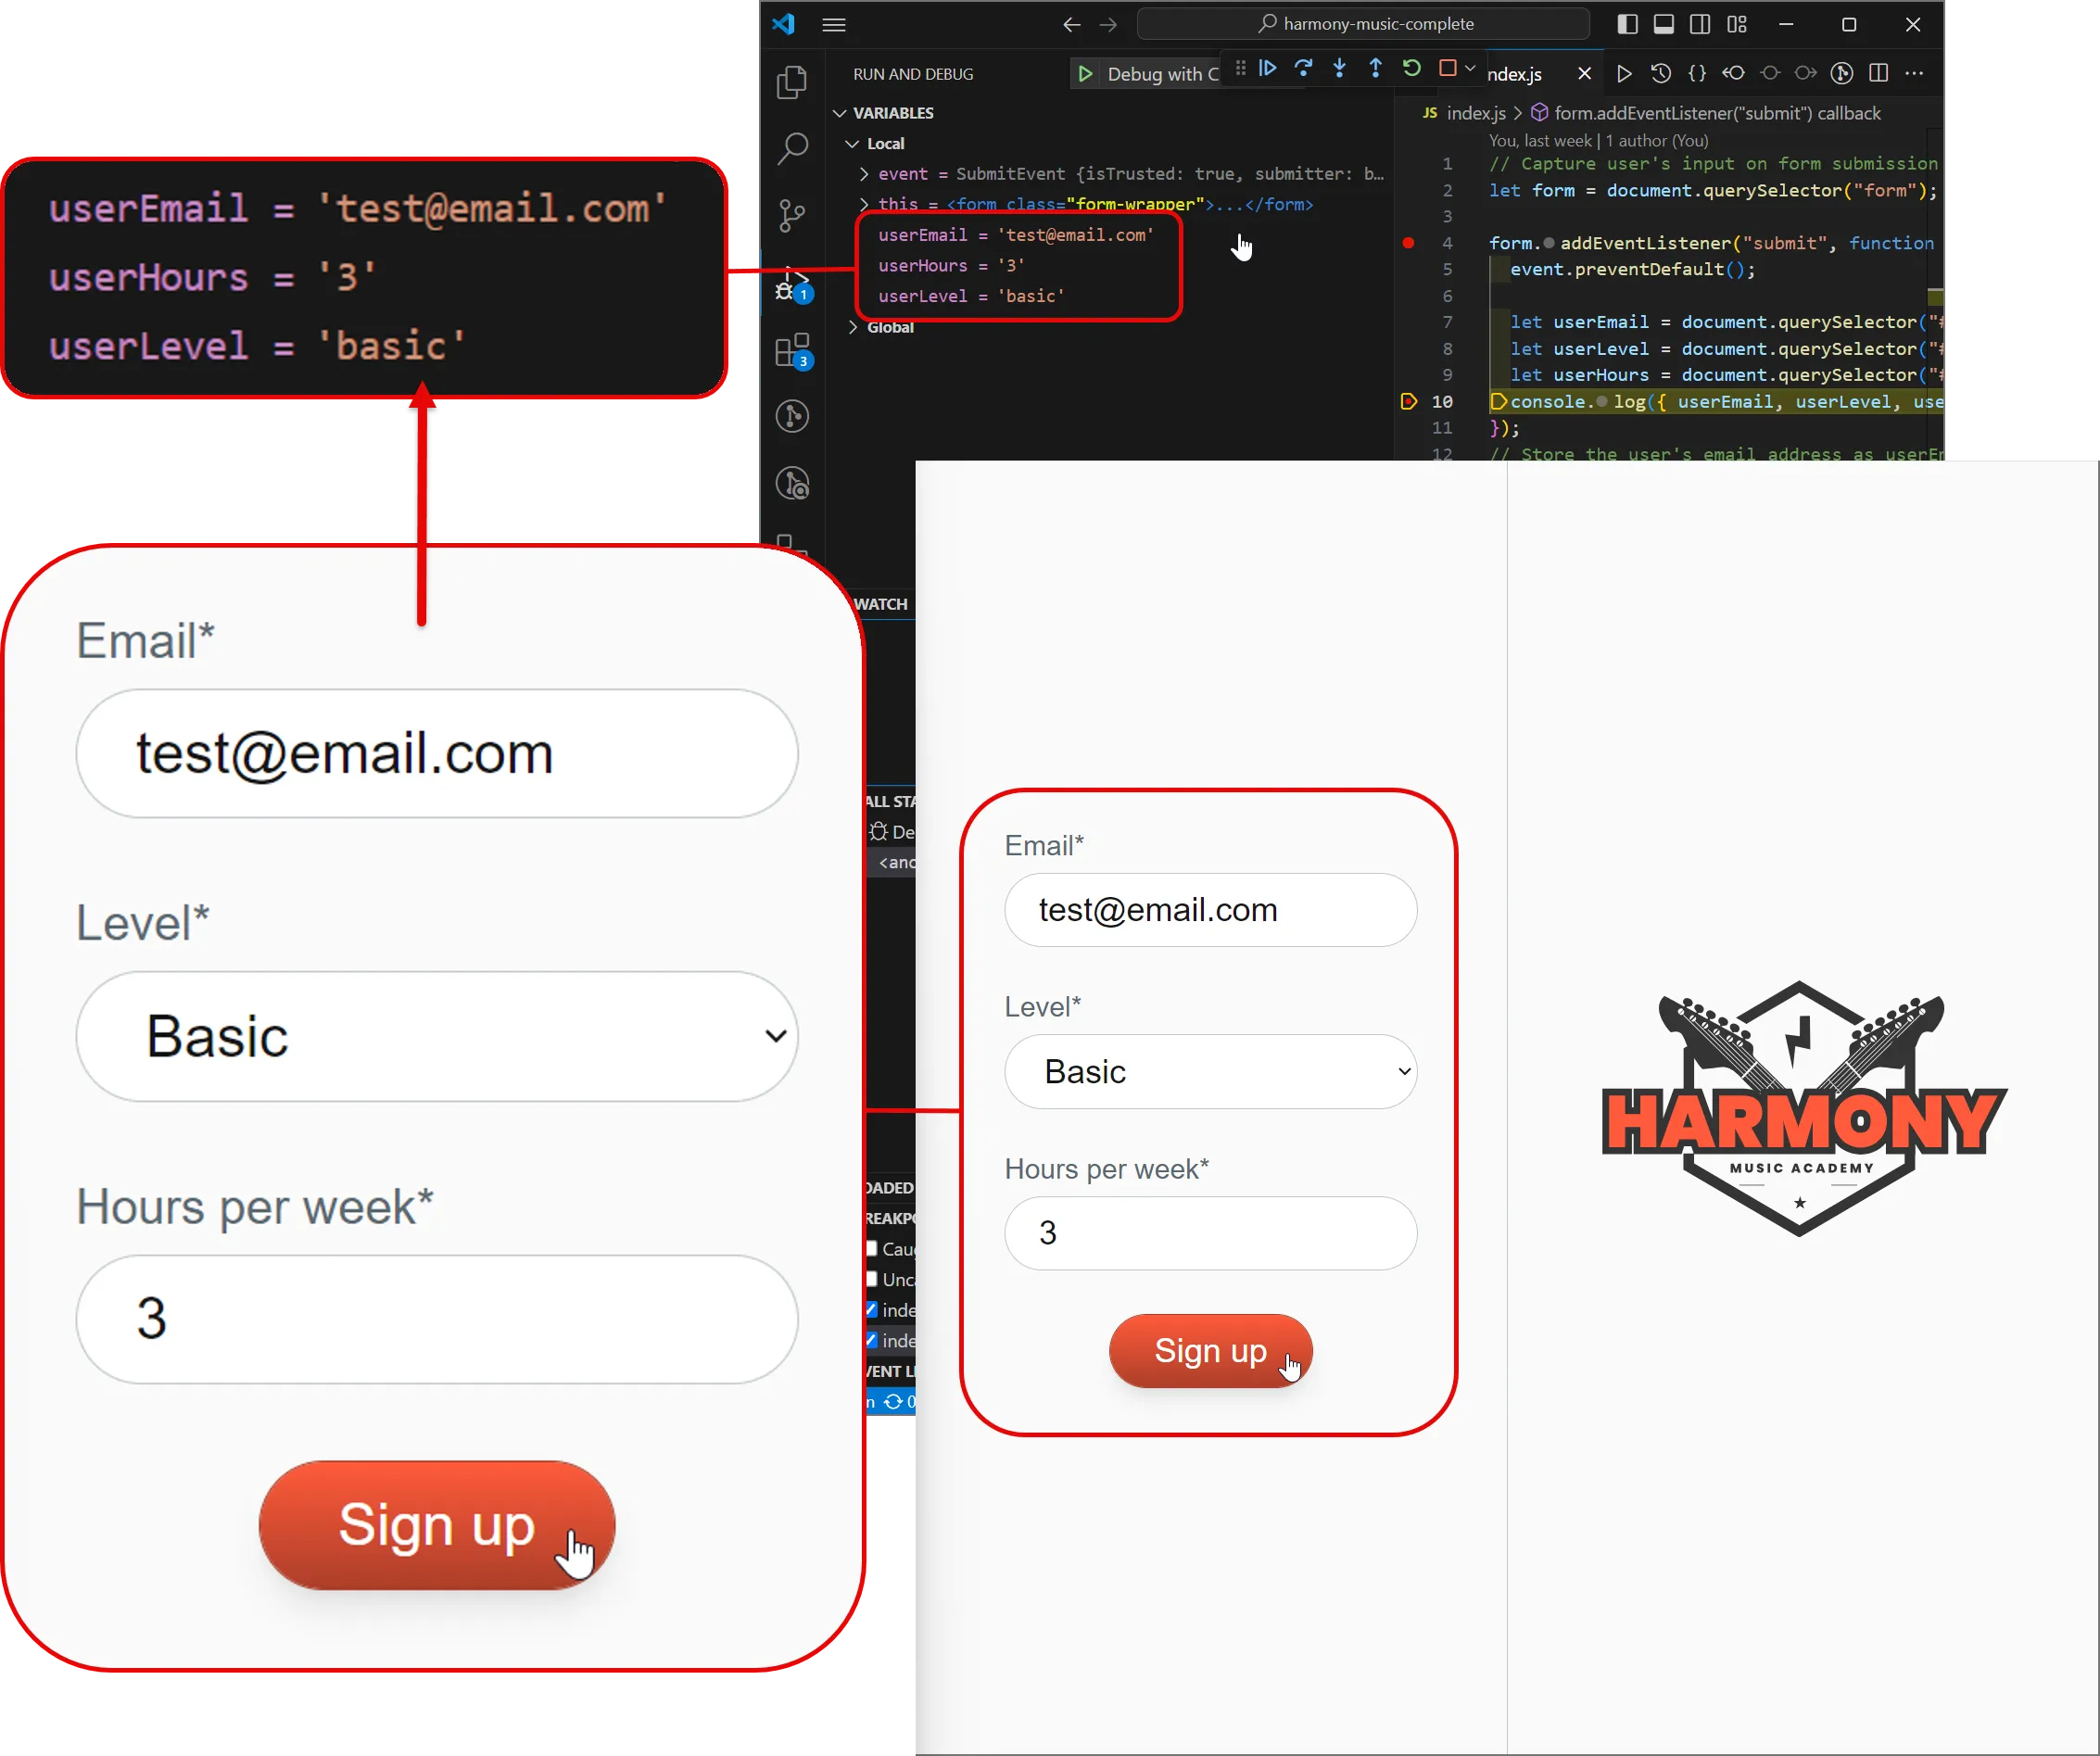
When you are ready, you can hit the ‘Stop’ button to end the debugging session.
Summary
Section titled “Summary”Logging and breakpoints are two of the most common debugging techniques that you can use to identify and fix issues in your code.
By logging values to the console, you can see what your code is doing and verify that it is working as expected.
By adding breakpoints to your code, you can pause execution at specific points and inspect the state of your code at that point in time.
These techniques can help you identify and fix issues in your Harmony Music code, making it easier to build and maintain your projects.
If you run into problems with your code, use these debugging techniques to help you find and fix issues.
Next steps
Section titled “Next steps”In the next tutorial, we will validate the form data from the Harmony Music website.